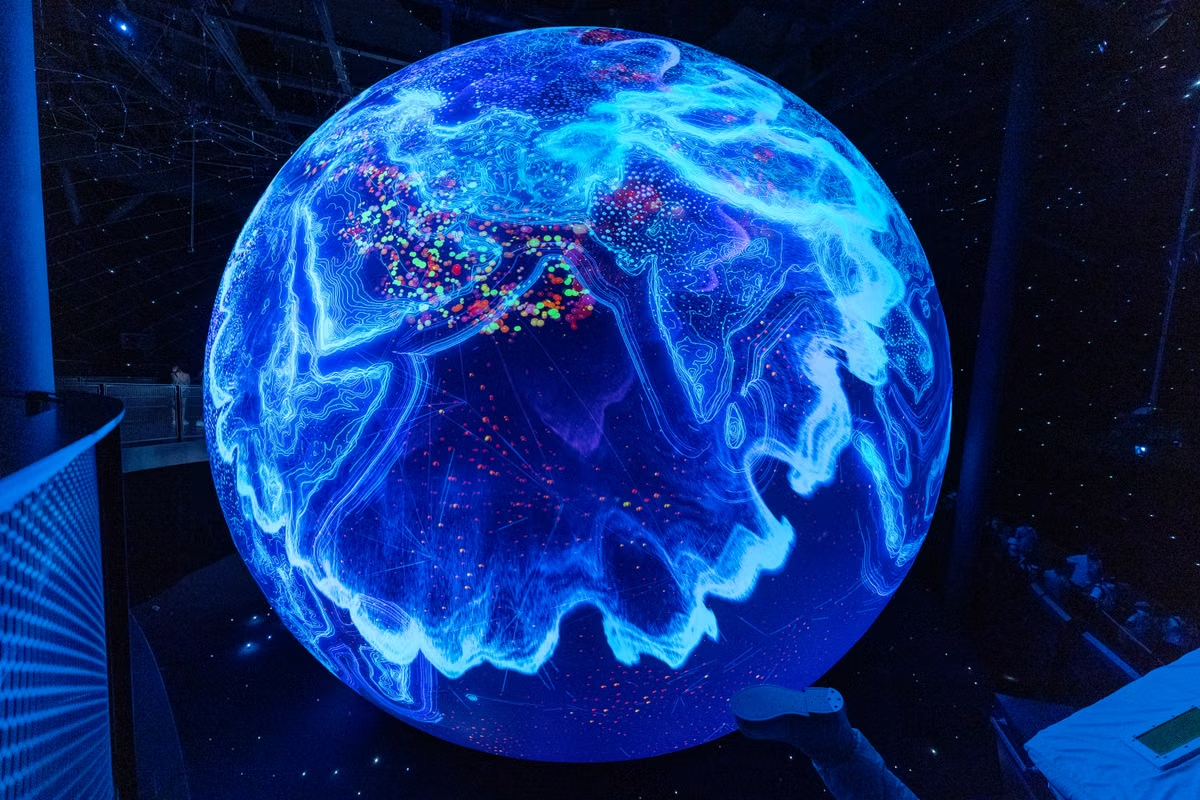
For developers, researchers, and data journalists assessing Gods-Eye-View, the key distinction is between an interactive map and verifiable evidence. This review explains how to evaluate imagery and live-signal layers, document a lead, and decide when independent sources are necessary.
The globe shows a moving aircraft, but you cannot tell whether its position is current or complete.
Fast answer: Gods-Eye-View is worth trying for exploration, demonstrations, and finding leads. It is not real-time satellite surveillance, and a map view alone cannot verify an event. Check each layer’s source, timestamp, coverage, and terms before relying on it.
This is for developers assessing a browser-based geospatial project and open-source intelligence enthusiasts organizing public-source leads. It also helps data journalists and technical educators decide what a map can—and cannot—support. If you need confirmed event evidence or precise monitoring, treat the display as a starting point, not the conclusion.
Last updated October 13, 2026. We checked the project’s official README and data-source documentation. Layer availability and source descriptions can change, so check the repository again before using the project for current research.
What does Gods-Eye-View open-source intelligence actually show?
Gods-Eye-View is best understood as a browser interface for viewing geographic context and public signals together. Its official project documentation describes a globe-based view and multiple map or signal layers. That makes it useful for exploring where information appears in relation to places and other visible data. It does not make the displayed information independently verified. Check the project overview and data-source documentation for the project’s current descriptions.
A map can combine information with very different origins and update behavior. Keep these categories separate as you interpret the view:
- Base map and terrain: They provide geographic reference, such as coastlines, roads, or elevation. They help orient a viewer, but they are not necessarily evidence of a recent event.
- Imagery layer: It may show a satellite or aerial image used as a visual backdrop. The image’s capture date can differ from the date the map was accessed or refreshed.
- Dynamic signal layer: It can plot information such as aircraft or vessel positions when the relevant source provides it. Its coverage and update behavior depend on that source.
- Your interpretation: A visible pattern may suggest a hypothesis. That hypothesis is yours to test; the visualization does not turn it into a confirmed fact.
This distinction matters because “visible on the globe” says little by itself about when a source collected the underlying information, whether the source covers the whole area, or whether a plotted object is correctly identified. The software can make layers easier to inspect. It cannot erase the limitations of the data behind them.
Our editorial score: strong for geographic exploration; conditional for preliminary research; weak as stand-alone evidence. Use it to find a question worth checking. Do not cite a screenshot as proof without tracing its underlying source.
When is the browser 3D globe useful for exploring place and imagery?
A browser 3D globe can make spatial relationships easier to understand than a flat list of coordinates. You can orient yourself around a location, relate a signal to nearby terrain, and communicate where a possible lead appears. That is valuable for an initial survey, a classroom demonstration, or a newsroom map used to explain geographic context.
But a globe is a presentation format, not a freshness guarantee. Satellite imagery is especially easy to misread. A tiled basemap may combine imagery captured at different times, and the date you see in a viewer—or the date its tiles were served—may not be the capture date of the image. Esri’s explanation of how image dates can differ in a world imagery layer is a useful reminder to look for imagery metadata instead of treating the display as a live camera.
When you inspect satellite imagery data sources, record what is actually documented:
- The provider or dataset name, rather than just the layer label shown in the interface.
- The image acquisition date, if the source exposes it. A map’s refresh time is not a substitute.
- The geographic footprint and resolution information provided by the source.
- Any attribution, reuse, or commercial-use terms relevant to the way you plan to publish it.
The same care applies to map features. If a layer uses OpenStreetMap data, follow the project’s copyright and attribution guidance. Attribution requirements are not interchangeable with permission to reuse every image or dataset visible in the same interface. Check each layer’s own terms.
A familiar-looking map background can provide orientation; it cannot establish that the pictured location reflects conditions at the time you opened the browser.
For a teaching slide, a clearly credited map may be enough to explain location. For a claim about recent construction, damage, or movement, you need an identifiable image source and a date that supports the claim. If the interface does not expose those details, label the image as context or find another source.
Dynamic layers can surface leads, not prove events
They can help you notice a possible lead. The project’s data-source documentation should be your starting point for determining what a specific layer claims to display. Do not assume every layer has the same supplier, coverage, or refresh schedule simply because the layers appear together in one interface.
Aircraft and vessel feeds illustrate why source-by-source checks matter. The FAA explains that aircraft tracking depends on surveillance technology and that coverage or reception limitations can affect what appears in a feed; see its ADS-B frequently asked questions. A missing aircraft marker therefore does not, by itself, establish that no aircraft was present. A visible marker also needs to be checked against the underlying feed and its available time information.
Vessel data has its own constraints. Review the relevant provider’s documentation rather than assuming a ship layer is complete or continuously current. For example, AISStream’s documentation describes its message interface and operational limitations. The practical lesson is broader than any one service: a plotted position represents what the feed delivered, not necessarily every vessel or every moment.
For any moving-object layer, check:
- Provider: Who supplies the positions, and does the project link to that source?
- Time field: Does the record expose when the position was observed, received, or processed? These are different timestamps.
- Coverage: What geographic areas and signal types does the source describe? Look for documented gaps or reception limits.
- Missing records: Could an absent marker result from a coverage gap, a feed interruption, filtering, or a delayed update?
- Identity: Does the source provide a stable identifier, and can you confirm what that identifier refers to in the original data?
Satellite imagery and moving-target feeds are not interchangeable. A live-updating position feed is not live satellite imagery; an image background does not update an aircraft’s position. Different layer types also carry different meanings, so inspect the underlying source and its definitions instead of treating every point or line as the same kind of observation.
This is where a browser 3D globe earns its place: it can bring separate leads into one spatial view. It does not make those leads more complete or more accurate simply by placing them on the same screen.
How should you turn a map observation into a testable claim?
Treat an unusual pattern as a hypothesis. Then preserve enough detail for someone else to reproduce and challenge your interpretation. The process below works whether you are exploring aircraft, vessels, imagery, earthquakes, fires, or another public layer.
- Name the observation precisely. Write down what appears on screen without adding a cause. “A marker appears near the coast” is an observation. “A vessel is conducting a covert operation” is an interpretation.
- Record location and time. Save the coordinates, the time you viewed the layer, and any time field attached to the underlying record. Note the time zone. If the interface offers no timestamp or source record, make that gap explicit rather than guessing.
- Identify the layer and its supplier. Match the visible layer to the project’s documented data-source list. Follow its source link and inspect the original provider’s description. A name in the interface is not enough to determine how the data was produced.
- Check coverage and known limitations. Look for geographic gaps, missing observations, delivery delays, and filtering. USGS guidance on when earthquake information is posted explains why publication and notification timing should not be assumed to be instantaneous.
- Seek a genuinely independent source. Find an original document, a separate data provider, or a source with a different collection method. NASA’s FIRMS data-availability information can help establish what fire data is available; it is not automatically independent confirmation of another layer that uses the same underlying feed.
- Compare and preserve your evidence. Record the source URL, retrieval time, relevant dataset fields, and any changes you made to the view. Keep a copy of the original source record where its terms allow. Then state what the evidence supports and what remains uncertain.
Two markers, screenshots, or map layers do not count as independent corroboration if they derive from the same underlying feed. Trace the data lineage before describing sources as separate.
This workflow also answers a common question about checking aircraft and vessel data in a browser globe: validate the original record, its observation time, and the feed’s coverage. A screenshot can help document what you saw, but it rarely carries enough information to prove where a target was or why it was there.
When you assess a public event, distinguish three levels of confidence in your notes: what the interface displayed, what the original source recorded, and what independent evidence supports. This prevents an attractive visualization from quietly becoming the strongest—and only—basis for a claim.
Which use cases fit, and where should you draw the line?
The right use depends on the consequence of being wrong. Gods-Eye-View may be useful at different stages, but the evidence standard should rise as the output moves from a demonstration to a public claim.
Demonstration or teaching: The globe can help explain geographic relationships and show how distinct layers appear together. Credit each source and label uncertain or time-sensitive data. If the purpose is to teach map interpretation, an explicitly marked example is safer than presenting an unverified lead as a confirmed event.
Initial research: Use the view to identify questions, not to close them. Preserve coordinates and timestamps, inspect the original dataset, and compare independent evidence before drawing conclusions. If a layer lacks a source description, timestamp, or usable coverage information, downgrade it to visual context.
Public reporting or high-impact assessment: Go back to primary records and confirm that their dates, terms, and limitations support the wording of your claim. A map image may expose personal or sensitive location information. Before publishing it, consider privacy, attribution, licensing, and the potential consequences of misidentification. For a high-risk judgment, the project’s output is not a substitute for source review and appropriate editorial or legal checks.
The project may make public information easier to explore, but public availability does not mean unrestricted reuse. A dataset can have attribution obligations, licensing restrictions, or conditions that apply differently to a screenshot, an exported dataset, or a commercial publication. Check both the project’s documentation and the source provider’s terms. If you cannot establish the relevant conditions, do not treat the layer as cleared for publication.
A scorecard helps set expectations:
- Geographic exploration: high. The globe offers a shared spatial view for browsing documented layers.
- Lead generation: moderate. It can help surface patterns, but each lead needs source-level checks.
- Event verification: low as a stand-alone tool. A displayed feature is not independent corroboration.
- Precision monitoring: unsuitable without verified source-specific guarantees. Confirm the provider’s update behavior and coverage before relying on a layer operationally.
These ratings describe appropriate uses, not a measured performance benchmark. They are based on the distinction between an interface and the sources it displays.
Use this decision path before relying on a layer
- If the official project documentation names the layer and links to its provider, use the display for exploration and follow the provider’s source record before making a claim. Otherwise, treat the layer as unverified context and do not use it as evidence.
- If the relevant record has a meaningful observation time and documented coverage, compare it with the time and location of your question. Otherwise, avoid describing it as current, complete, or precise.
- If a separate source with independent data collection supports the same claim, document both sources and their limitations. Otherwise, describe the result as a lead or hypothesis.
- If reuse terms and privacy implications are clear for your intended use, publish with the required attribution and context. Otherwise, do not publish the layer or image until those conditions are resolved.
This decision path is deliberately conservative. It is easier to gather stronger evidence before publication than to correct a claim that presented a visualization as certainty.
Before opening the globe, keep a short verification record:
- Layer name and source provider.
- Data or image timestamp, plus the time you accessed it.
- Geographic coverage and any documented gaps.
- Whether another source is genuinely independent.
- Attribution, licensing, privacy, and publication conditions.
If any field is unknown, record it as unknown. Do not fill gaps with assumptions based on how smoothly a layer animates or how detailed the basemap looks.
For developers testing geospatial interfaces, browser behavior matters too: a layer that renders correctly in one environment may not behave identically under a different browser, network, or deployment setup. If you are evaluating where to run an open-source visualization, ZekVPS’s Mac VPS options provide context on a remote Mac environment. For background on the provider and its services, see about ZekVPS. These pages are relevant to environment planning, not evidence about the accuracy of Gods-Eye-View’s data.
Verdict: useful for exploration, not a source of certainty
Try Gods-Eye-View if you need a quick geographic overview, a way to explore public layers, or a visual aid for explaining spatial context. Do not rely on it alone to establish that an event happened, that an image is current, or that an aircraft or vessel feed is complete. The deciding factors are the individual source, its timestamp, its coverage, and whether independent evidence supports your interpretation.
Compared with checking primary datasets directly, a map interface can save time when you are scanning for leads. But it can also hide source differences behind a unified display, encourage false confidence in missing or stale data, and leave reuse conditions easy to overlook. If your next step is to evaluate a deployment or browser-testing environment rather than to treat the map as evidence, use the linked ZekVPS resources as planning references. The map is a useful front end for questions; the answer still depends on the sources you can verify.
Turn a Map View Into a Verifiable Lead
Read our practical guides to check imagery dates, resolution, and attribution before treating a layer as current evidence.
Use a repeatable workflow to record coordinates, timestamps, and screenshots for each observation.
If you are moving MCP or Agents from demo to daily use, a snapshot-ready cloud Mac node beats swapping frameworks again. View ZekVPS cloud Mac mini plans — Separate lab from daily driver for calmer deployments.